Carbon Emissions; Peak Demand; Cycling Operation; Time Zones; Natural Gas Combined Cycle
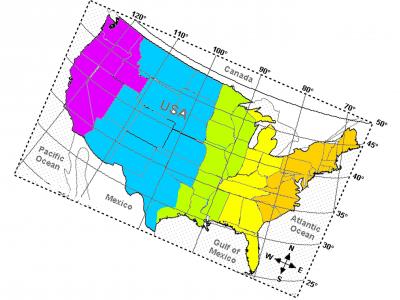
It is observed from the pattern of Electricity Demand in the months of November 2022 and March 2023 that switchover from Summer Time to Winter Time and vice versa causes a shift in demand pattern corresponding to the time shifts. The hourly electricity demands of US48 states have been shown in separate excel files for November 2022 and March 2023. In sheet 2 of both the excel files, a graphical plot of the average hourly demands in the week before the switchover has been compared with a graphical plot of the average hourly demands in the week after the switchover.
- Categories:
 30 Views