Datasets
Standard Dataset
Monte-Carlo tolerance analysis dataset
- Citation Author(s):
- Submitted by:
- li jing
- Last updated:
- Tue, 04/26/2022 - 06:01
- DOI:
- 10.21227/js16-9k51
- License:
 164 Views
- Categories:
Abstract
Normal
0
7.8 磅
0
2
false
false
false
EN-IN
ZH-CN
X-NONE
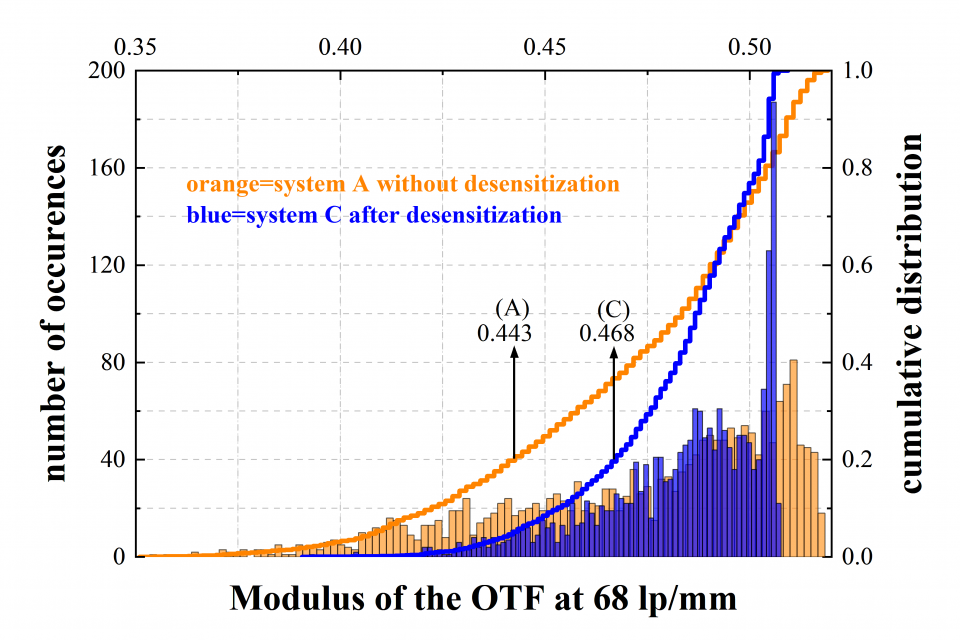
The data consists of 2 sets of 2000 data points histograms and cumulative integral plots.
For 80% of the MTF, the system without desensitization is above 0.443, and the system after desensitization is above 0.468. The results obtained before desensitization and after desensitization are not much different. From the point of view of the cumulative integral curve, when the MTF is high, the slope of the curve of the system after desensitization is relatively large, that is, the performance distribution of the system is more concentrated under the tilt tolerance. The standard deviation of the system without desensitization is 0.034. The standard deviation of the system after desensitization is 0.020, which is 59% of the system without desensitization, indicating that the tilt sensitivity of the system after final desensitization is lower.
Normal
0
7.8 磅
0
2
false
false
false
EN-IN
ZH-CN
X-NONE
/* Style Definitions */
table.MsoNormalTable
{mso-style-name:普通表格;
mso-tstyle-rowband-size:0;
mso-tstyle-colband-size:0;
mso-style-noshow:yes;
mso-style-priority:99;
mso-style-parent:"";
mso-padding-alt:0cm 5.4pt 0cm 5.4pt;
mso-para-margin:0cm;
mso-pagination:widow-orphan;
font-size:10.0pt;
font-family:"Times New Roman",serif;
mso-ansi-language:EN-IN;
mso-fareast-language:EN-IN;}


