Synthesized Absorbance Spectrum of Gas Mixture using HITRAN Database
- Citation Author(s):
-
Tao Lu
- Submitted by:
- Yifeng Bie
- Last updated:
- DOI:
- 10.21227/evz5-wz10
- Data Format:
- Links:
 51 views
- Categories:
- Keywords:
Abstract
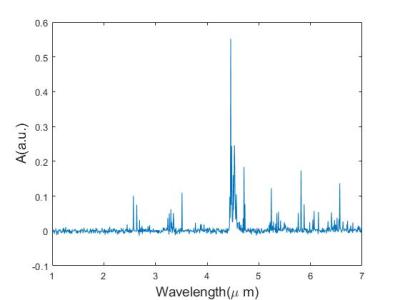
The dataset is the synthesized absorbance spectrum of a set of 9-gas mixtures following Beer-Lambert Law. We used the mid-infrared absorption cross-section spectra of C2H6, CH4, CO, H2O, HBr, HCl, HF, N2O, NO from the high-resolution transmission molecular absorption (HITRAN) database. Each sample contains 1,000 observations equally spaced between 1 µm and 7 µm wavelengths. The concentrations of the nine gases are mutually uncorrelated and follow uniform distribution between 0-10 µM. To mimic noise, we added Gaussian noise to the input light intensity at each wavelength and defined the signal-to-noise ratio (SNR) of our dataset as the ratio between the input light intensity and noise power.
Instructions:
The dataset is a set of synthesized absorbance spectra of C2H6, CH4, CO, H2O, HBr, HCl, HF, N2O, and NO from the HITRAN (L. S. Rothman, I. E. Gordon, Y. Babikov, A. Barbe, D. C. Benner,P. F. Bernath, M. Birk, L. Bizzocchi, V. Boudon, L. R. Brown, et al., “The HITRAN 2012 Molecular Spectroscopic Database,” Journal of Quantitative Spectroscopy and Radiative Transfer, vol. 130, pp. 4–50,2013.) database.
We synthesized four datasets with SNR from 10 dB to 40 dB. The datasets are in .csv format. Each one has 100,000 samples, and each sample has 1009 components. The first 1,000 components are the observation of the spectrum between 1 µm and 7 µm wavelengths; the rest nine are the concentrations of the nine gases. The first row of the .csv file is the label (wavelength and gas).


