Datasets
Standard Dataset
Percentage of Pell students in engineering
- Citation Author(s):
- Submitted by:
- Michelle Klopfer
- Last updated:
- Wed, 09/25/2024 - 11:54
- DOI:
- 10.21227/51c6-0271
- Data Format:
- License:
 164 Views
- Categories:
- Keywords:
Abstract
Contribution: This study provides the first comprehensive dataset on the socioeconomic diversity of U.S. engineering and computer science programs, offering benchmarks and insights for institutions seeking to increase low-income student enrollment.
Background: While many institutions focus on increasing gender and racial diversity in STEM fields, socioeconomic diversity remains understudied, in spite of the high potential for economic mobility inherent in engineering and computer science degrees. This study aims to fill that gap by examining Pell-eligibility rates within engineering programs across various U.S. institutions, offering insights into institutional characteristics that support or hinder the inclusion of low-income students in these high-opportunity fields.
Research Questions: How do Pell-eligibility rates in engineering compare to non-engineering programs? How do Pell-eligible rates vary by institutional type, size, and region?
Methodology: Data on Pell-eligible students were collected from 139 U.S. institutions with at least 200 undergraduate engineering students. Statistical analyses included correlation, t-tests, Wilcoxon tests, linear regression, and Kruskal-Wallis tests.
Findings: Engineering programs have lower Pell-eligibility rates than non-engineering programs, with an average gap of 2.9 percentage points. Public institutions and schools in the West region had higher Pell-eligibility rates, providing valuable insights for diversity initiatives.
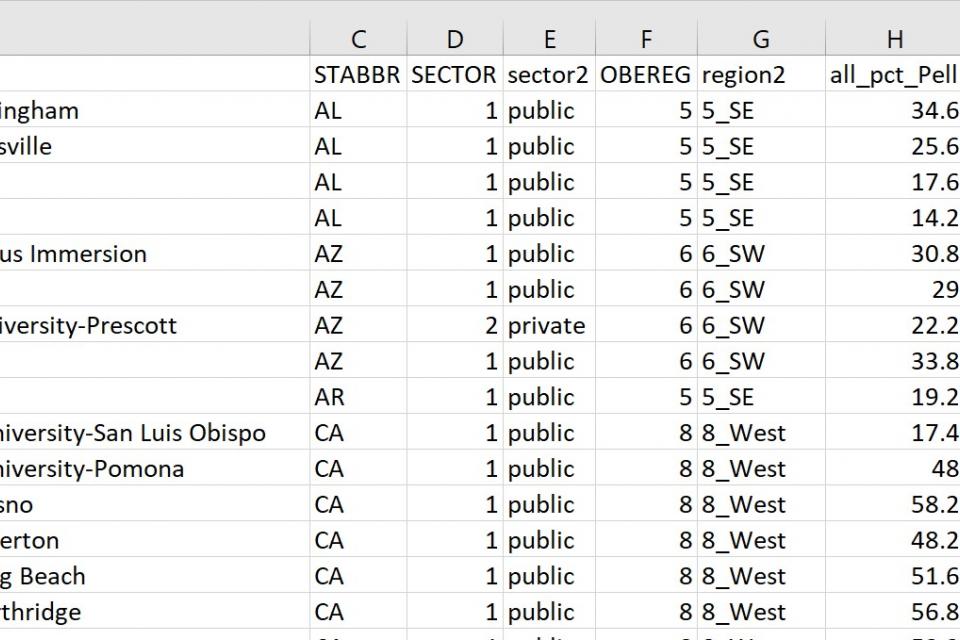
The accompanying dataset, Pell_in_engineering.csv, provides comprehensive data on Pell-eligible student enrollment in U.S. undergraduate engineering programs, collected from 139 institutions. The dataset includes information on both engineering and non-engineering programs, allowing users to compare Pell-eligible percentages across different fields of study. Data on institutional characteristics such as sector (public or private), geographic region, and state are also included, enabling further analysis of how institutional factors influence socioeconomic diversity in engineering programs.
Key Variables:
- UNITID: The 6-digit IPEDS code for each institution.
- INSTNM: Institution name.
- STABBR: State abbreviation.
- SECTOR: Institutional sector (public or private 4-year schools).
- OBEREG: Bureau of Economic Analysis regions, with both numeric and text versions.
- all_pct_Pell: Percentage of all undergraduates awarded Pell Grants (mean of 2017-2021 IPEDS data).
- Eng_pct_Pell: Percentage of undergraduate engineering students awarded Pell Grants (obtained directly from institutions, typically 2018-2022 data).
- nonEng_pct_Pell: Percentage of non-engineering undergraduates awarded Pell Grants (calculated from IPEDS and Eng_pct_Pell data).
To explore the data, users can begin by analyzing the Pell-eligible percentages across engineering and non-engineering programs, or by examining patterns based on institutional sector or region. Additional school data can be accessed through the IPEDS data center using the institution’s UNITID.
Dataset Files
- Percentage of Pell-eligible engineering students at US instititutions Pell_in_engineering.csv (10.18 kB)
Documentation
| Attachment | Size |
|---|---|
| 76.27 KB |


