EOG/IOG graph
- Citation Author(s):
-
Tianyi Deng
 (Hunan University)
- Submitted by:
- Tianyi Deng
- Last updated:
- DOI:
- 10.21227/m604-nj11
 169 views
Abstract
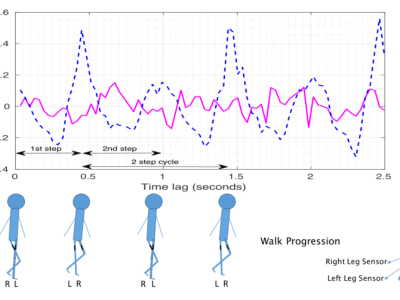
These are some graphs that record the human ocular electrical signals and ocular impedance signals, each image from top to bottom is a time-frequency graph of the EOG, the EOG signals, the time-frequency graph of the impedance signals, the impedance signals, and the impedance signals, respectively. This dataset is used to train the eye movement detection model.
Instructions:
This dataset conforms to the VOC2007 format, each image is of a fixed size, the images are filtered, differenced and normalized, the top image represents the time-frequency plot of the EOG signal, a line in the middle represents the original EOG signal, the bottom image represents the time-frequency plot of the IOG, and a line at the bottom represents the original IOG signal. The label files are stored in the Annotations folder, which records the labels corresponding to the images, with a total of five categories, 0, 1, 2, 3, and 4, corresponding to blink, up, down, left, and right, respectively.