Networked Microgrids
- Citation Author(s):
-
Gaochen Cui (Tsinghua University)Qing-Shan Jia
 (Tsinghua University)
Xiaohong Guan (Tsinghua University)Qiaozhu Zhai (Xi'an Jiaotong University)Xianping Guo (Sun Yat-Sen University)Qi Guo (China Southern Power Grid)
(Tsinghua University)
Xiaohong Guan (Tsinghua University)Qiaozhu Zhai (Xi'an Jiaotong University)Xianping Guo (Sun Yat-Sen University)Qi Guo (China Southern Power Grid) - Submitted by:
- Qing-Shan Jia
- Last updated:
- DOI:
- 10.21227/rmys-3d35
- Data Format:
 458 views
- Categories:
- Keywords:
Abstract
This is the snapshot of the directories included in this dataset, which are load, price, pv, and wind. Within each directory, there is an .xlsx file that list the detailed data in that category. These data are used in an article titled "Consensus-based distributed reinforcement learning with primal-dual update for networked microgrids on-line coordination."
Instructions:
This is the dataset used in an article titled "Consensus-based Distributed Reinforcement Learning with Primal-Dual Update for Networked Microgrids On-Line Coordination", and is currently under review in an IEEE publication. This dataset is therefore used for any researcher who is willing to check or to develop further research results on that article. When the status of that article is updated, this instruction will be updated accordingly.
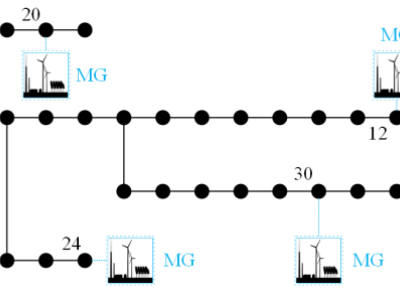
This dataset is for multi-MG system simulation, providing power load data, renewable energy data, and electricity price. All the data are original from https://dataport.pecanstreet.org/.
For power load, file load.xlsx records the daily load curves. These curves are normalized to values in [0, 1], so the users may decide the max value for each load node. Each column is a daily load curve, and each row is the averaged power in 5 minutes.
For solar power, file solar.xlsx records the daily power generation curves with unit as MWh. Each column is a daily generation curve, and each row is the averaged power in 5 minutes. The users could normalize the data to [0, 1] and set the max value for each PV node.
For wind power, file five_min_wind_power_forecast.csv records the daily wind power generation curves with unit as MWh. All the curves are concatenated in column G. The users may extract the daily curves and normalize the data to a file in format as load.xlsx.
For electricity price, file price.xlsx records the daily real-time electricity price curves with unit U.S. $/MWh. Each column is a daily price curve, and each row is the averaged price in 5 minutes.
For the above data, the users could add random noise to increase the diversity. In each simulation, a curve could be randomly selected for each node. Each combination is a scenario and the total number exponentially increases with the bus number.