Datasets
Standard Dataset
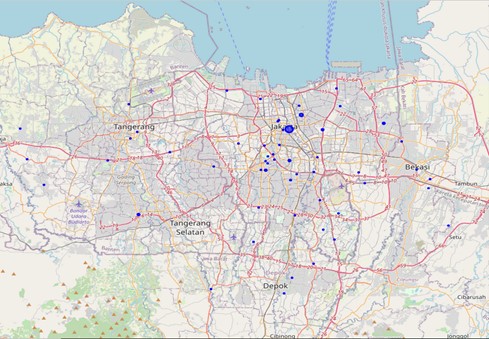
Existing JADETABEK EVCS
- Citation Author(s):
- Submitted by:
- Tuga Mauritsius
- Last updated:
- Sat, 01/11/2025 - 08:43
- DOI:
- 10.21227/artk-nv29
- Data Format:
- License:
 193 Views
- Categories:
- Keywords:
Abstract
The dataset contains 56 rows and 51 columns, detailing various characteristics of EV charging stations (SPKLU) in the Jadetabek area. Key attributes include station identifiers, transaction metrics (e.g., number of transactions, unique users, average duration), geospatial data (latitude, longitude, easting, northing), administrative divisions, and location criteria. It also captures proximity to infrastructure such as roads, toll gates, and other EV stations, alongside charger counts for different types, population metrics, and income levels. Additionally, the dataset includes counts of nearby facilities and recreational areas. All columns are complete, with no missing values, and data types include integers for counts, floats for continuous measures, and strings for categorical information. This dataset provides a rich foundation for analyzing operational and locational aspects of SPKLU.
Instructions for Utilizing the Dataset
1. Loading the Dataset
Ensure you have a Python environment with necessary libraries (e.g., pandas, numpy) to load and process the dataset. Example code:
import pandas as pd
# Load the dataset
file_path = 'path_to_file.xlsx'
data = pd.read_excel(file_path)
2. Analyzing the Data
Use basic pandas functions to explore the data:
# View first few rows
data.head()
# Summary statistics
data.describe()
# Check for missing values
data.isnull().sum()
3. Performing Geospatial Analysis
The dataset includes geospatial coordinates (latitude, longitude, easting, northing). Use libraries like geopandas or folium for mapping and spatial analysis.
import folium
# Create a map centered on a location
m = folium.Map(location=[-6.2, 106.8], zoom_start=10)
# Add SPKLU locations
for _, row in data.iterrows():
folium.Marker([row['latitude'], row['longitude']], popup=row['evcs_name']).add_to(m)
m.save('map.html')
4. Conducting Statistical Analysis
Perform analyses to identify patterns, trends, or correlations, such as:
- Analyzing usage patterns (num_transaction, sum_of_kwh)
- Examining spatial proximity and user density
- Evaluating charger type distributions
5. Visualization
Use libraries like matplotlib or seaborn for data visualization:
import matplotlib.pyplot as plt
import seaborn as sns
# Plot transaction distribution
sns.histplot(data['num_transaction'], bins=20)
plt.show()
Dataset Files
- Operating SPKLU in Jadetabek Area Operating SPKLU Jadetabek Ver 4.xlsx (33.84 kB)
- Script File Script.txt (1.42 kB)
Documentation
| Attachment | Size |
|---|---|
| 19.71 KB |


