Machine Learning

Link prediction and graph classification datasets for heterogeneous graphs in DGL format
- Categories:
 222 Views
The dataset used in the study consists of different IoT network traffic data files each IoT traffic data has files containing benign, i.e. normal network traffic data, and malicious traffic data related to the most common IoT botnet attacks which are known as the Mirai botnet.
- Categories:
 1118 Views
<h1>It include Multi-source data that affect stock prices, such as stock historical trading data and stock forum sentiment indicator.<h1>
搜索
复制
- Categories:
 492 Views
Ovarian cancer is among the top health issues faced by women everywhere in the world . Ovarian tumours have a wide range of possible causes. Detecting and tracking down these cancers in their early stages is difficult which adds to the difficulty of treatment. In most cases, a woman finds out she has ovarian cancer after it has already spread. In addition, as technology in the field of artificial intelligence advances, detection can be done at an earlier level. Having this data will assist the gynaecologist in treating these tumours as soon as possible.
- Categories:
 2750 Views
The I Scan 2 scanner from Cross-Match Technologies was used to acquire all data. Iris images are captured in near-infrared wavelength band (700-900 nm) of the electromagnetic spectrum. All images were acquired in SAP laboratory of computer science and engineering department of Dr. Babasaheb Ambedkar Marathwada University, Aurangabad. The subject images were acquired during the span of 7 to 8 months in years 2017 and 2018. GMBAMU-IRIS dataset contains total 5616 images from 312 subjects.
- Categories:
 439 Views
Most of the existing human action datasets are common human actions in daily scenes(e.g. NTU RGB+D series, Kinetics series), not created for Human-Robot Interaction(HRI), and most of them are not collected based on the perspective of the service robot, which can not meet the needs of vision-based interactive action recognition.
- Categories:
 370 Views
The Phoenix Contact Relay (PCR) dataset is provided for the development of algorithms for the analysis of lifetime data. It differs from previously published datasets in the number and complexity of measurements, as well as the scope of units tested and the practical relevance of the data. Thus, it provides an opportunity to develop and evaluate new concepts for predictive maintenance. The PCR data set presented includes the life data of 546 relays with a total of more than 106 million switching cycles, collected over a period of several years at a sampling rate of 10 kHz.
- Categories:
 496 Views
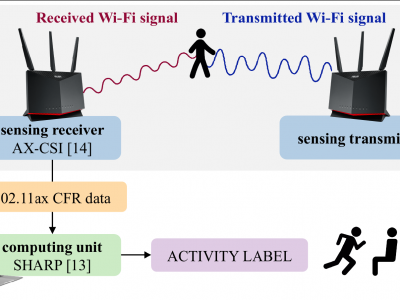
The dataset includes channel frequency response (CFR) data collected through an IEEE 802.11ax device for human activity recognition. This is the first dataset for Wi-Fi sensing with the IEEE 802.11ax standard which is the most updated Wi-Fi version available in commercial devices. The dataset has been collected within a single environment considering a single person as the purpose of the study was to evaluate the impact of communication parameters on the performance of sensing algorithms.
- Categories:
 2746 Views
This dataset contains CIRs from 23 different positions in an industrial environment, as illustrated in the picture.
These originate from a tag-anchor pair configured with two-way-ranging for distance estimations. In total, 21 anchors are placed in the area, allowing both Line-of-Sight (LOS) and Non-LOS (NLOS) signal propagation, as illustrated in the picture.
The aim during the data collection proces was to measure UWB ranging errors in (N)LOS environments. As such, the ground truth of each position was measured using a laser.
- Categories:
 644 Views
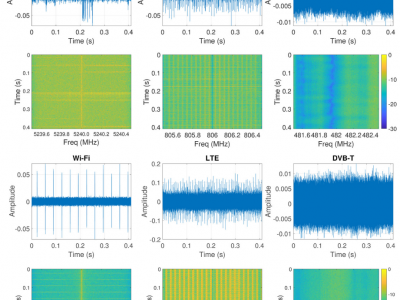
This dataset contains IQ samples captured over-the-air in six different locations in Gent, Belgium (UZ, Reep, Rabot, Merelbeke, iGent and Gentbrugge). Each location has unique data characteristics (e.g. different signal strength and noise levels) due to different physical signal propagations. As an example, these differences in two locations (top two and bottom two rows) are displayed on the spectrograms.
- Categories:
 957 Views


